I just read that Stephen King says that the NRA should “clean up the blood and brains after the next the next massacre.”
These people are shockingly ignorant of reality. Even more so, they are dangerous to the health and safety of our nation. All of these mass shootings have been happening in “Gun Free Zones”. An idea set forth by Liberals. Most all of these maniacs that caused these grievous incidents have all been Democrats, or have been known to support Liberal ideology. Now, let’s take a look at an interesting map.
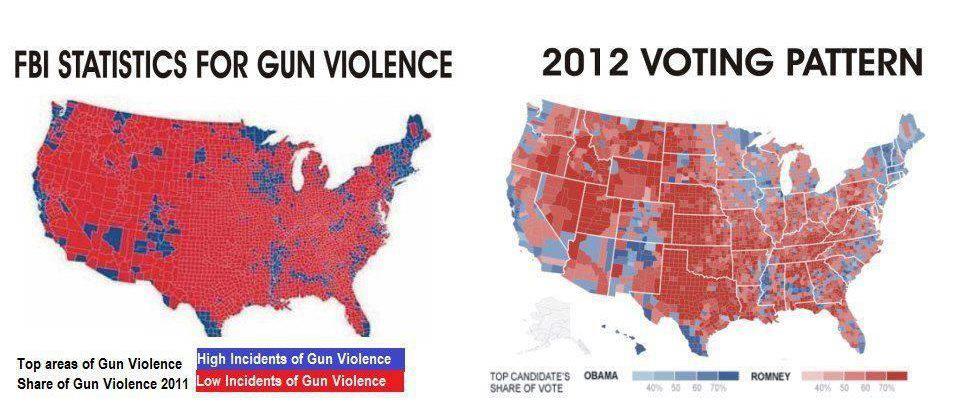
The most “Gun Violence” is happening in areas of high gun control, in areas where the Democrats have been running everything. Not only have Democrat Policy have been failing America, but they are failing themselves. Now they point at the NRA as the ones to blame?
The solution is very clear. We don’t need to Ban Guns. We need to Ban Democrats from Owning Guns and from Public Office and Administration.
Update: It was brought to my attention that the crime map is fake. Okay. So let’s put up a real one.
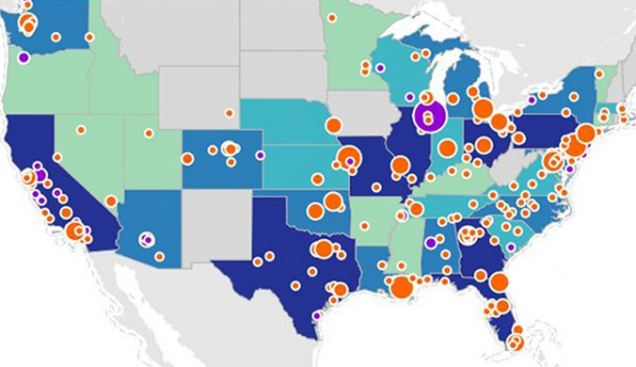
This one shows us that pretty much – Pack a Gun to keep you safe no matter where you are. And Democrat States remain the most dangerous.
Here’s a new one by one of our Readers…

Interesting gun violence map. Unfortunately I think that one is a little off as the only one I can find with cited sources seems different. Link: http://cdn.theatlantic.com/static/mt/assets/richard_florida/FirearmDEDIT.jpg
Would love to hear that this map/sources are dubious. Any leads?
Also what year is that crime map from? The 2006 FBI one I’ve got doesn’t match it very well. Maybe it’s more recent? Or not adjusted for population? Link: http://www.doc.state.ok.us/maps/UCRVioCrim06.jpg
BBC.
Have anything more fresh than 2006?
Link?
Don’t have a map offhand. Can probably come up with something from the latest FBI tables but that’d have to wait until tomorrow when my GIS comp is fired up. That being said, the 2010 tables themselves show similar patterns E.G. UT is at 212 violent crimes per 100,000, NY at 392, TX 440, TN at 660, NH at 167, ect. If you’re interested though let me know and I’ll see if I can whip up a graphic.
Numbers and data from http://www.fbi.gov/about-us/cjis/ucr/crime-in-the-u.s/2010/crime-in-the-u.s.-2010/tables/10tbl05.xls
http://i.dailymail.co.uk/i/pix/2012/07/27/article-2179995-143F84C2000005DC-433_636x367.jpg
I think some Brits might take offense at you calling the Daily Mail the BBC…
So the bottom map is a count of mass shootings since 2005 and the dots (of either color) represent cities. Makes sense that the higher and more densely populated areas would have higher counts.
Clearly, areas of high population density have more crime.
Oh, and also places where there are more people living in a given geographic area. 🙂
Which traditionally run dominantly liberal. While I am absolutely for the ideal that we must always argue our position from fact, I think in the end we could find that the initial map picture is probably accurate.
This is going to require some legwork and some map layering for accurate comparison. I will be following this thread with interest. It would be great if we can correlate the data and then create a true map picture to enlighten our fellow citizens.
Crap that was awful eloquent pc response of me. I want to say I’m sorry for that. I am taking an American Government class right now and working on the homework. It forces me to not degrade myself to calling my Obama gushing classmates the fucking idiots that they are.
Definitely a cool idea, Jesse. If we can find data I can visualize it no problem. I actually just sent George a map of 2010 crime adjusted for density. Any thoughts on other good figures?
The holy grail for anything related to population comes from the census bureau.
The holy grail for crime statistics comes from the FBI, which will gauge its per capita population (thats the per 100,000 for those folks who don’t know) from the census bureau and aggregate these numbers with its numbers collected on crime.
So, in my mind this would be a perfect map of data –
2010 will be the most recent year in which all of the data will be the most accurate:
Layer a map with population density (source census bureau) –
Layer the map with crime of choice for population density (source FBI, possible census bureau, possible cdc) –
Layer with political affiliation or voting for precinct (tons of sources for that) –
Bam you have your map. I would suspect that the map will correlate quite nicely.
And with the latest royal decrees… I mean executive orders the cdc will be conducting this very same exercise as part of its ongoing study on how to take our guns… I mean reduce gunviolence. I think it would be important if our side accurate put this together first. Especially if it can be done with readily accessable information and lacking a 10 million dollar tax payer funded budget.
Sheep flock together.
The map on the left is not what you think it is…
http://www.wallsofthecity.net/2013/01/lies-damned-lies-and-statistics.html
Ah, yes, hence my update and the second map. Thanks for pointing it out again though.